Updated Feb 2026

How to Analyze Your Twitter/X Audience Demographics

Export your follower data to a spreadsheet and uncover who actually follows you — their locations, influence levels, account ages, and more. Make data-driven decisions about your content strategy.

Intermediate
15 minutes
7 steps

Before You Start

  • Google Chrome browser (desktop)
  • An X (Twitter) account (logged in)
  • Followers Exporter Pro for X installed from the Chrome Web Store
  • A spreadsheet application (Excel, Google Sheets, or similar)
1

Install Followers Exporter Pro for X

Visit the Chrome Web Store listing and click "Add to Chrome." The extension uses your existing logged-in X session — no API keys or developer accounts needed.
2

Export your followers to CSV

Navigate to your X profile page and click the floating PlugMonkey button to open the exporter panel. Your username is auto-filled. Select "Followers" and click "Start." The extension fetches your entire follower list with 20+ data fields per account, including display name, bio, location, follower count, following count, tweet count, verified status, and account creation date. A progress bar shows real-time completion status.
Pro Tip

For accounts with large follower counts (10K+), the export may take several minutes. Leave the tab open and let the extension work — it handles rate limiting automatically.

3

Download the CSV and open it in your spreadsheet
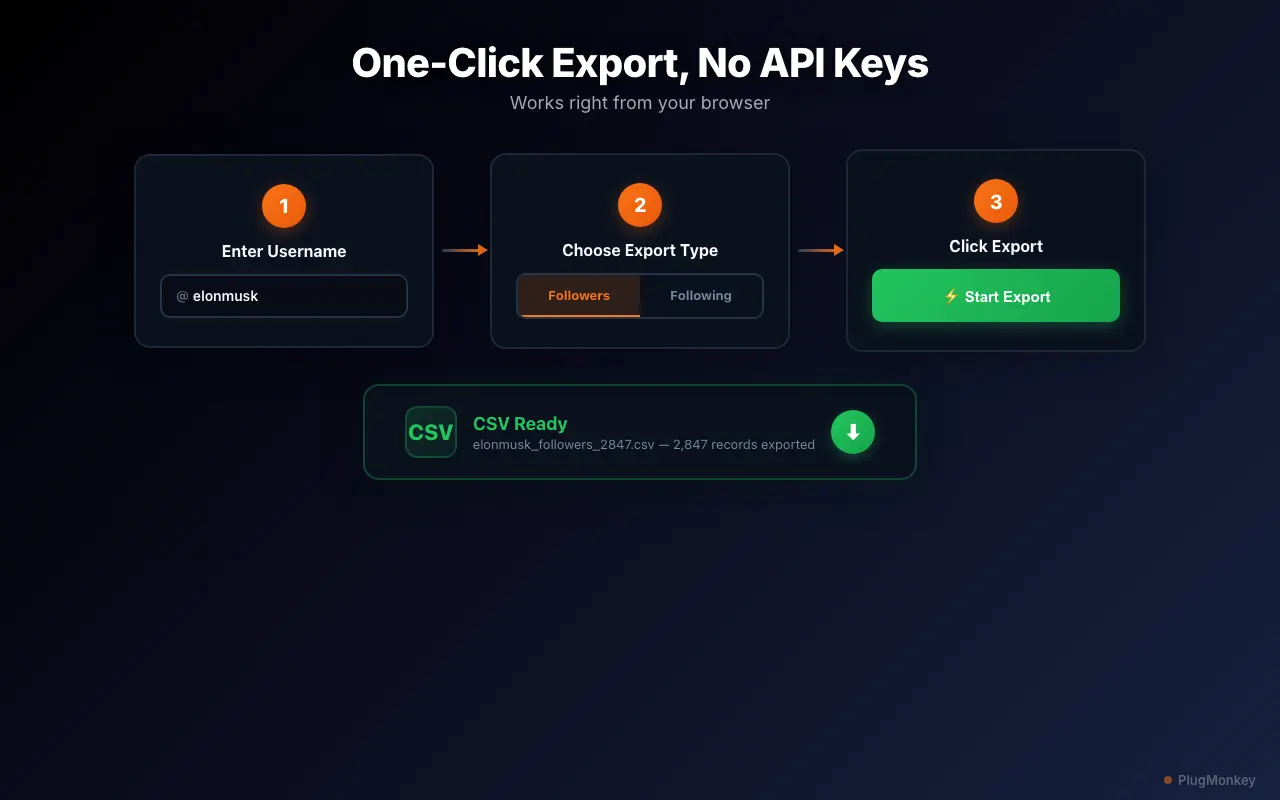
Once the export completes, click "Download CSV." Open the file in Google Sheets or Excel. You will see columns for Username, Display Name, Bio, Location, URL, Followers Count, Following Count, Tweet Count, Listed Count, Verified, Created At, Profile Image URL, and more. Each row represents one follower.
Followers Exporter Pro for X's data table previewing exportable follower fields
4

Analyze geographic distribution using the Location field

The Location column contains self-reported locations from follower bios. In Google Sheets, use Data > Create a filter and sort by Location (A to Z) to group followers by geography. For a quick breakdown, create a pivot table: Insert > Pivot table, add Location as Rows and COUNTA of Username as Values. This shows you how many followers are in each location. Clean up common variations (e.g., "NYC", "New York", "New York City") for more accurate grouping.
Pro Tip

Not all followers fill in their location — expect 40-60% to have this field populated. Focus on the data you have rather than worrying about missing entries. The populated entries still give you a reliable directional picture of your geographic distribution.

5

Identify your most influential followers

Sort the spreadsheet by Followers Count (descending) to find your most influential followers — the accounts with the largest audiences of their own. These are potential amplifiers for your content. Export the top 50-100 influential followers to a separate sheet and note their bios, industries, and content themes. These are the people whose retweets and engagement drive the most visibility for your posts.
Pro Tip

Create a VIP list of your top 20 most influential followers. Engage with their content regularly — replying to and retweeting influential followers builds relationships that lead to organic amplification of your own content.

6

Segment by account age and engagement level

Use the Created At column to analyze account ages. Create a formula to calculate years since account creation: =DATEDIF(DATEVALUE(LEFT(G2,10)),TODAY(),"Y") where G2 is the Created At cell. Followers with older accounts (5+ years) tend to be more established and engaged. Cross-reference account age with Tweet Count to identify active vs. dormant followers. High tweet count + old account = engaged follower. Low tweet count + old account = lurker. New account + high following count = potential bot.
7

Build audience personas from bio analysis

Scan the Bio column for recurring themes, job titles, and interests. In Google Sheets, use CTRL+F (or CMD+F) to search for common terms: "founder", "CEO", "developer", "marketer", "student", "designer", etc. Count how many bios contain each term to build a rough breakdown of your audience composition. This tells you what types of people your content attracts and helps you tailor future posts.
Pro Tip

Export your audience persona breakdown into a simple chart. Share it with your team or use it to inform your content calendar. Knowing that 30% of your followers are developers vs. 15% marketers changes what you should post.

Summary

You now have a detailed understanding of your Twitter/X audience demographics using real data from your follower list. Geographic distribution tells you where your audience lives. Influential follower identification reveals who amplifies your content. Account age and engagement segmentation separates active followers from lurkers and bots. Bio analysis uncovers the professions and interests of the people who follow you. Run this analysis quarterly to track how your audience evolves over time — export new CSVs and compare them against previous snapshots. This data-driven approach to audience understanding beats guessing and leads to better content strategy decisions.

Need More Help?

Get personalized AI assistance with additional tips and troubleshooting.

AI responses are generated independently and may vary

Frequently Asked Questions

Understand Who Actually Follows You

Followers Exporter Pro for X gives you the raw data. Export followers, analyze demographics, and make smarter content decisions. Free to install.